
Design Articles
What is a Structure List? What are the key components of the Structure List?
In the overhead transmission line, the structure list is the backbone or a single roadmap to be followed from the project execution point of view. The structure list includes the following information.
1) STRUCTURE NO: The structure number represents the tower number starting from the very first point which may include Gantry.
2) STATION: the station represents the chainage or location of a structure along the transmission route. It is usually measured in meters or kilometers from a reference point, such as the start of the transmission line or a substation. It is typically recorded in kilometers or meters with a format like 1+250 km (meaning 1 km and 250 meters).
3) P.I. NO: PI (Point of Intersection) refers to the location where two transmission line segments change direction. It is a crucial point used in transmission line route alignment to define angles and the placement of different types of towers. At a PI, an angle tower (such as a tension or suspension tower) is often required to support the directional change in the line. The angle towers are used when the line deviation exceeds an angle greater than 2°; They are classified as below:
Small Angle Towers (2°–10°)
Medium Angle Towers (10°–30°)
Large Angle Towers (30°–60°)
4) ELEVATION OF TOWER POINT: The elevation of a tower point refers to the height above a reference level (usually mean sea level or ground level) where a transmission tower is to be installed.
Key Considerations for Tower Elevation: (From the Design point of view)
Terrain Profile: Higher elevations may require taller towers to maintain ground clearance.
Sag and Clearance: Conductors sag more at higher elevations due to temperature variations and wind effects.
Load Calculations: Wind and ice loads vary with elevation, impacting tower design.
Access & Foundation Design: Higher elevations may require special foundation considerations, such as pile or anchor foundations.
5) UTM COORDINATES OF STRUCTURES: UTM (Universal Transverse Mercator) coordinates are used to precisely locate transmission line structures on the Earth's surface. These coordinates provide a high-accuracy, grid-based location system that divides the Earth into zones (each 6° longitude wide), making it ideal for mapping transmission line routes.
Additional Info:
Saudi Arabia is covered by multiple UTM (Universal Transverse Mercator) zones, depending on the longitude of the location. The country falls within UTM Zones 36N to 40N in the Northern Hemisphere.
UTM Zones in Saudi Arabia
Zone 36N → Covers the westernmost part (near the Red Sea and parts of Makkah and Medina).
Zone 37N → Covers central-western areas, including parts of Makkah, Medina, and Riyadh.
Zone 38N → Covers the central region, including Riyadh and eastern parts of Medina.
Zone 39N → Covers the eastern region, including Dammam, Dhahran, and Jubail.
Zone 40N → Covers the far eastern areas near the border with the UAE and Oman.
How to Determine the UTM Zone for a Specific Location in Saudi Arabia?
You can use:
✅ GPS devices (GNSS receivers)
✅ GIS software (Google Earth, QGIS, ArcGIS)
✅ Online UTM coordinate converters
Knowing the UTM zone is essential for accurate surveying, mapping, and engineering projects such as transmission line design, road construction, and land development.
6) LINE DEFLECTION ANGLE: The line deflection angle is the angle formed between two consecutive transmission line segments at a tower location where the line changes direction. It is measured between the incoming and outgoing conductors and determines the type of tower required at that point.
7) SPAN AHEAD: Span Ahead refers to the horizontal distance between a transmission tower and the next tower in the forward direction along the transmission line route.
8) WIND SPAN OR HORIZONTAL SPAN:
Wind span is half the sum of the adjacent span lengths supported on any one structure.
Wind span slightly higher than basic span.
9) WEIGHT SPAN OR VERTICAL SPAN:
The weight span is the distance between the lowest points on adjacent sag curves on either side of the structure.
It represents the equivalent length or weight of conductor supported at any time.
10) WEIGHT TO WIND SPAN RATIO:
The ratio of weight span to wind span is important as the insulators on lightly loaded structures may be deflected excessively thus impairing electrical clearances.
The minimum ratio of 0.7 is considered acceptable (Design engineer must be aware of max. weight span & such ratio).
11) SECTION LENGTH: Section Length refers to the total distance between two terminal or tension points in a transmission line, typically between two dead-end towers or major angle towers. It represents a continuous stretch of the transmission line without a break in mechanical tension.
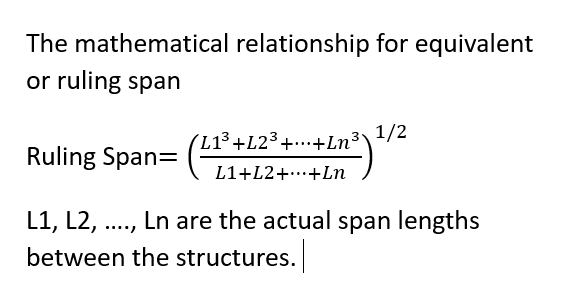
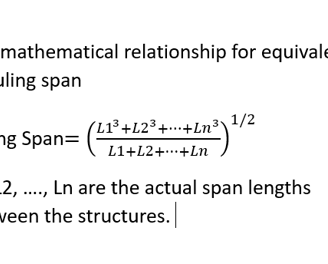
12) RULING SPAN:
The Ruling Span (also called Equivalent Span) is the theoretical uniform span length that represents the overall mechanical behavior of a transmission line section with varying spans. It simplifies sag and tension calculations by assuming a single span length for design purposes.
Formula for Ruling Span: Refer the article image.
13) TOWER HEIGHT: Tower Height refers to the vertical distance from the base of a transmission tower to the highest point of the tower structure, which is typically the topmost point of the cross-arm or the point where the conductors are attached. It is an essential factor in transmission line design, ensuring that the line meets the required clearances from the ground and other obstacles, and is capable of handling environmental factors such as wind, ice, and temperature changes.
14) TOWER CONFIGURATION: It includes body extension, leg extension and tower types.
15) FOUNDATION: It shows where the foundation is pad & chimney or pier foundation, and also the soil type.
16) GROUNDING: Normally this grounding column includes footing resistance data.
17) HARDWARE ASSEMBLY: It includes
INSULATOR SUS. ASSEMBLY
INSULATOR TENSION ASSEMBLY
DOUBLE TENSION ASSEMBLY UPRIGHT
DOUBLE TENSION ASSEMBLY INVERTED
JUMPER ASSEMBLY
And, SWT & SWS (Shield Wire Tension Set, OPGW & Shield Wire Suspension Set, OPGW)
18) REMARKS: It shows any crossings, rivers, flood areas, fences, etc. throughout the line if any.
The above information is all about the STRUCTURE LIST used in Overhead Transmission Line.
Please subscribe this website for more future updates.
What is Link Loss Budget (LLB) & Why is it required to show in OPGW Joint Box locations drawing? Loss Budget Calculation for OPGW Using OTDR & Power Meter (PM-LS)
The Link Loss Budget in a key map showing OPGW (Optical Ground Wire) Joint Box locations refers to the total allowable optical power loss in the fiber optic communication link, considering all components such as fiber attenuation, splice losses, connector losses, and other factors.
Components of Link Loss Budget in an OPGW Network:
1. Fiber Attenuation Loss – Loss due to the optical fiber itself (typically 0.35 dB/km at 1310 nm and 0.22 dB/km at 1550 nm).
2. Splice Loss – Loss at fusion splicing points (typically 0.05 – 0.1 dB per splice).
3. Connector Loss – Loss at connectors (typically 0.2 – 0.5 dB per connector pair).
4. OPGW Joint Box Loss – Losses introduced at the joint enclosure where fiber splicing is done.
5. Additional Losses – Loss due to bending, aging, and environmental factors.
Purpose in a Key Map:
★It ensures that the total optical signal loss is within acceptable limits for reliable transmission.
★Helps in planning OPGW routes and optimizing joint box locations.
★Allows engineers to verify signal strength at different sections.
Link Loss Budget Calculation for OPGW Using OTDR & Power Meter (PM-LS)
1. OTDR-Based Link Loss Budget Calculation
OTDR measures the backscattered light and provides a graphical view of the fiber losses.
Example Scenario:
Total Fiber Length = 50 km
Fiber Attenuation = 0.22 dB/km @ 1550 nm
Number of Splices = 10 (each splice loss = 0.05 dB)
Number of Connectors = 2 (each connector loss = 0.3 dB)
OPGW Joint Box Loss = 0.2 dB (assumed for mechanical losses)
Calculation:
1. Fiber Loss = 50 km × 0.22 dB/km = 11.0 dB
2. Splice Loss = 10 × 0.05 dB = 0.5 dB
3. Connector Loss = 2 × 0.3 dB = 0.6 dB
4. OPGW Joint Box Loss = 0.2 dB
5. Total Link Loss (OTDR) = 11.0 + 0.5 + 0.6 + 0.2 = 12.3 dB
📌 OTDR Limit: If the measured loss is greater than 12.3 dB, there could be excessive bending, poor splicing, or fiber damage.
In Conclusion: OTDR is useful for pinpointing faults, splice quality, and reflection points. PM-LS is better for end-to-end loss measurement, including connector losses. Both should match closely, or further inspection is needed.


Riyadh
Saudi Arabia
Email:
ohtldesign123@gmail.com
© Design OHTL 2025. All rights reserved.